The first Covid case in Italy was found on February 21st 2020. A couple of weeks later we were entering the lockdown with this number of new daily cases.
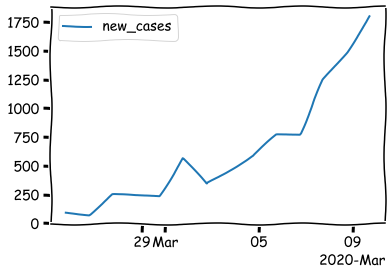
The number of Covid-19 new cases was growing really fast every day. We had no clue about what was going to happen and about when it would have ended. Was it going to end soon? How quickly was the virus spreading? I was wondering whether our feelings and expectations would have turned out to be true or not. So, I run a little experiment with 7 friends. I asked each of them the following 2 questions on March 10th 2020:
- What will the total number of Covid19 cases be by April 1st?
- When will the number of new cases be smaller than 50 again?
The goal of these questions was to investigate our ability as humans to nearly understand the size and the duration of such an unseen event like a global pandemy. Let's look at the answers we gave to these 2 questions.
Total cases by April 1st
The total number of Covid19 cases in Italy was 110k (precisely 110574). These were our 7 predictions made on March 10th.
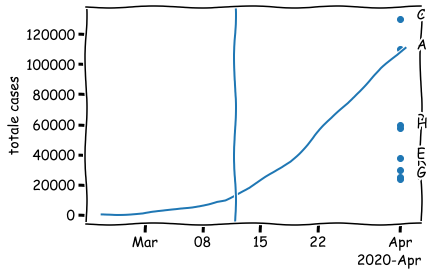
We see that 5 out of 7 respondents predicted a number of cases below 60k (with 2 respondents even below 25k). Only 2 out of 7 respondents gave more realistic predictions (110k and 130k respectively). Why were most respondents too optimistic? If we look at the very first chart, an exponential growth of new cases was already happening on March 10th. Perhaps, the majority of respondents were perceiveing the growth as linear.
Does our brain have misperceptions about exponential growth? My little experiment gave this insight, but I was curious whether there is some scientific literature about this misperception. I found a paper written back in 1975: "Misperception of exponential growth" by Wagennar and Sagaria.
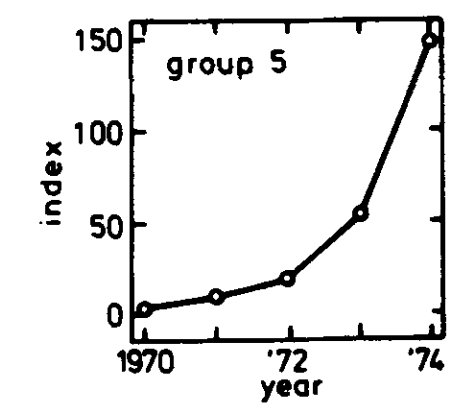
In this paper, researchers presented the beginning of an exponential time series starting ranging between 1970 and 1974. They presented this time series in different experiments both in the form of a series of numbers and in the form of a graph (see chart above). They asked to predict the value of this time series by 1979. A considerable underestimation of growth was encountered in all groups in all conditions.
The results of this paper helped me understanding why most of my respondents notably underestimated the growth of Covid-19 cases in Italy. Our brain is capable of intuitions only for linear growths and not for exponential growths.
The following question naturally comes up: if the underestimation of the Covid-19 growth was common in the vast majority of the citizens due to our unavoidable misperception, how has this impacted on micro and macro decisions when facing the pandemic?
New cases smaller than 50 again
We now move to the second question of my little experiment (asked on March 10th): "When will the number of new cases be smaller than 50 again?". Plotting the answers:
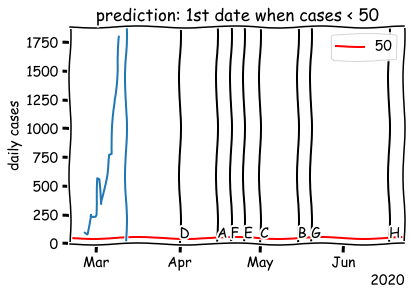
I drew a black vertical line for each date given as answer. We were too optimistic in this survey too. 5 out of 7 respondents expected the situation to go under control (the red horizontal line represents the threshold of 50 cases in the question) by May 1st. No one was expecting the high number of daily cases to go beyond June 18th. As of today (December 26th), the number of daily cases in Italy did not go below 50 in a single day since then.
We were just starting to experience an extraordinary event, and we were not expecting it to last for that long. This bias in perceiving the pandemic shorter than it was probably helped the social distancing policies. Changing your social habits is a privation that you willingly make if you expect it to last for a short time. Imagine that we knew Covid-19 would last for 9 months or even more.
Another question naturally comes up about the economic policies that were taken to tackle the pandemic: were they subject to the same short-term bias that was measured in this experiment?